Performance and DevTools
A while back, I wrote about improving web pages performance JS optimizing. Finding which parts of the app require optimization, and what exactly is the source of the issue can be challenging.
At this post, I’ll try to introduce some tools and routines that can help pin point the issue, and quickly testing our solution.
Performance matters
First, why should we even care?
Well, retaining users is hard. This days users expect things to be fast and smooth. Google’s study shows even a few seconds of loading time lag can make the session duration drop and bounce rate climb.
Even if we managed to load the page fairly quickly, bad UX is not easily forgiven.
If we can retain users, we loose business. In short Performance == Money.
Why measure
Remember kids, the only difference between screwing around and science, is writing it down.
A user “feels” the load time is long, or scroll is sluggish. Measuring allows us to translate such “feelings” into hard metrics. In other words, it shifts us from the qualitative discussion to a quantitative one.
Measurements allows us to define the problem
-
“The page loads at 5 seconds on a 1.5Mb download speed”.
-
“The on-scroll event handler takes 250ms to complete”
And even better, to define standards we wish to keep (maybe even protect by CI automation)
-
“To save network usage, our JS file should never exceed XX bytes.”
Measuring load time via audits
When analyzing a page, I like to start by running an audit. It shed light on most common issues that have a very good effort-to-value ratio.
Chrome dev-tools Audit tab can generates a Lighthouse report, but I find webpagetest more powerful because
- It can run on many devices / browsers.
- Allows testing from a different geographic locations.
- Records screen casts and screenshots
- Includes lighthouse audit.
The downside of an audit is that it only cover the page load time. It can’t track issues that require user interaction.
Once low handing fruits such as cache, minification and compression are cleared, we can attack finer issues with dev-tools.
DevTools overview
What are dev tools
In the past, debugging and profiling web pages was almost impossible. Breaking down how JS code runs, or how the page was rendered could be very hard to figure out.
Developers started to create developer-tools that would be attached to the browser as a plugin/extension, that would add functionality to the native browser (i.e. FireFox’s FireBug).
Those tools allow developers to observe how the browser runs the code, and more importantly, change it and see the impact immediately, making the debug cycle very short.
This days such dev tools are embedded natively in all major browsers.
Measuring performance via Chrome’s dev-tools
Chrome dev-tools offer many hidden gems. But before we dig into those, it is important that we understand what they tell us. We should understand what concepts such as FPS or jank means, and know how the browser execute the code we feed into it. I highly recommend this tutorial
Tips
  1. Open dev-tools with cmd+shift+I
  2. Quickly navigate between tools via cmd+shift+P
Real time monitors
Real time monitors help us understand how user’s action affect the UI and it’s performance impact.
- FPS Meter shows frame rate over time and GPU usage.
- Paint rectangles add noticeable green flash effect to areas that are being repainted.
- Performance Monitor tracks
- CPU & memory usage
- Counts DOM nodes, JS listeners, active assets (JS and CSS files) and iframes on page
- Count number of style calculations and layouts per second.
The next clip demonstrate those tools in action. See how hovering over elements on the page shows which parts of the page is being repainted, and the impact on the monitors.
Console
Many developers use only a fraction of the console abilities, but we can travel pretty deeply down that rabbit hole.
Setting the logs level to verbose will print common performance violations warning that are detected by the browser.
For example At next screenshots, the last log entry shows a setTimeout callback took to long to completed.

Network
While evaluating our app performance, it is important to simulate our end user environment as closely as possible. Things might works smoothly at the office with our high speed cable connection, but what about users with a slow G3 network?
Network tab allow us to do just that - test and monitor the page under simulated network configuration.
Another nice feature is Coverage that exposes dead code that can & should be deleted. Some teams like to define a network budget (i.e. JS Kb limit). Such limits can be enforced by CI automation).
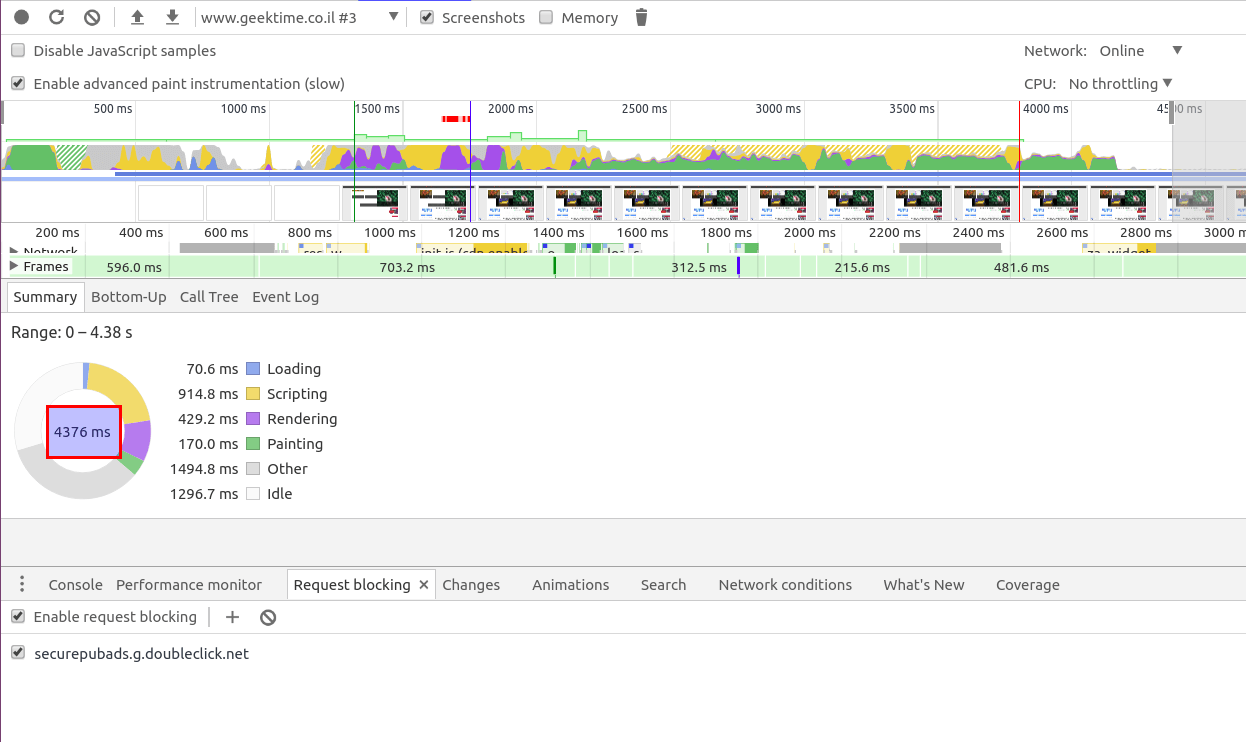
Request blocking allows blacklisting specific files/domains. For example, files we can block files with low coverage, and see it’s impact immediately.
Source
Aside from the obvious features of file-viewer and debugger, source tab has some useful utils.
Network shows all resources that were loaded by the page.
Snippets allows creating persistent code blocks, which can save repeated typing while debugging from the console.
In my view, the most powerful tool is overrides, which allows loading a local copy of a resource from our file system. This allows us to use dev-tools as an IDE. It is an extremely fast way to test code changes, no need to go through a full build-deploy cycle.
Performance
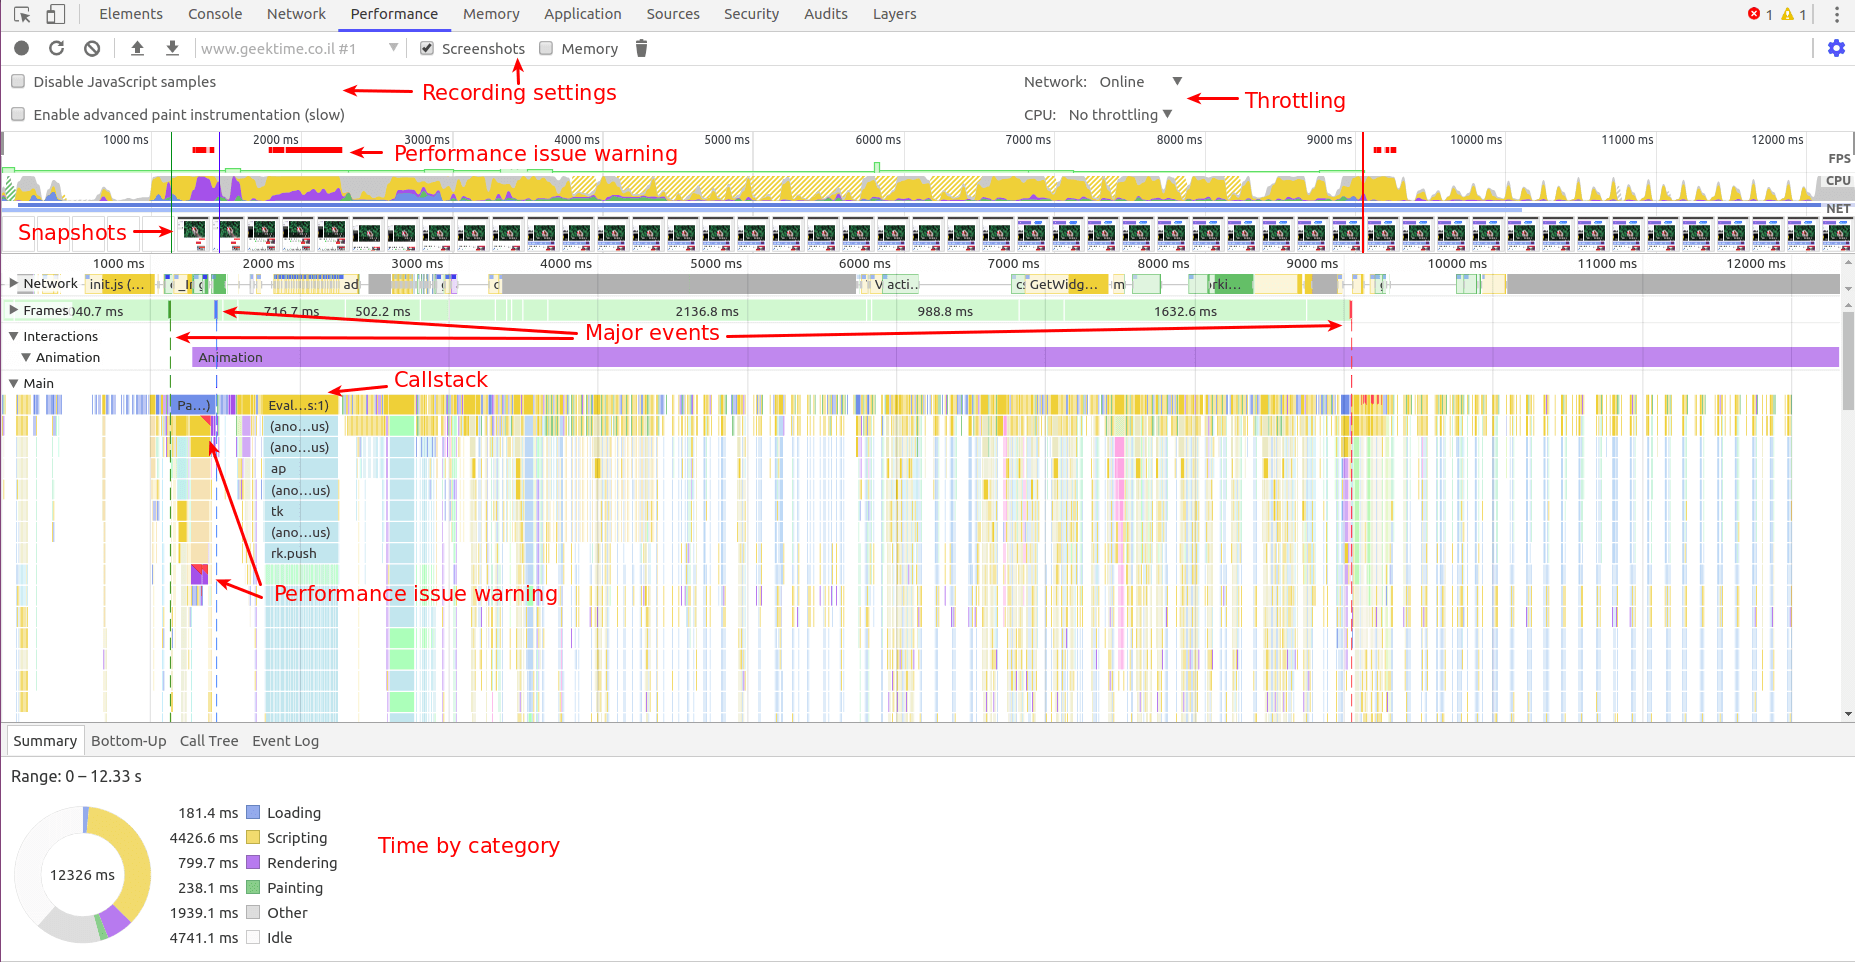
While the Performance monitors gives us an bird’s eye view on the page behavior, this tab allows a much deeper inspection. It can record page interactions and display key metrics over time.
The amount of data can be overwhelming. Without understanding the pixel pipeline discovering a the source of performance issue is like finding a needle in a haystack.
The matter is well covered at this doc, I’ll provide a short overview.

At the top we’ll find the recording settings. Just like at the network tab, we can throttle CPU, which can help surface performance issues.
While recording, take into account dev-tools own performance overhead.
We can minimize the noise by configuring the recording setting.
Below it, we’ll find FPS, CPU and network usage.
Next snapshots (if recorded), and a deeper breakdown of
- Network requests
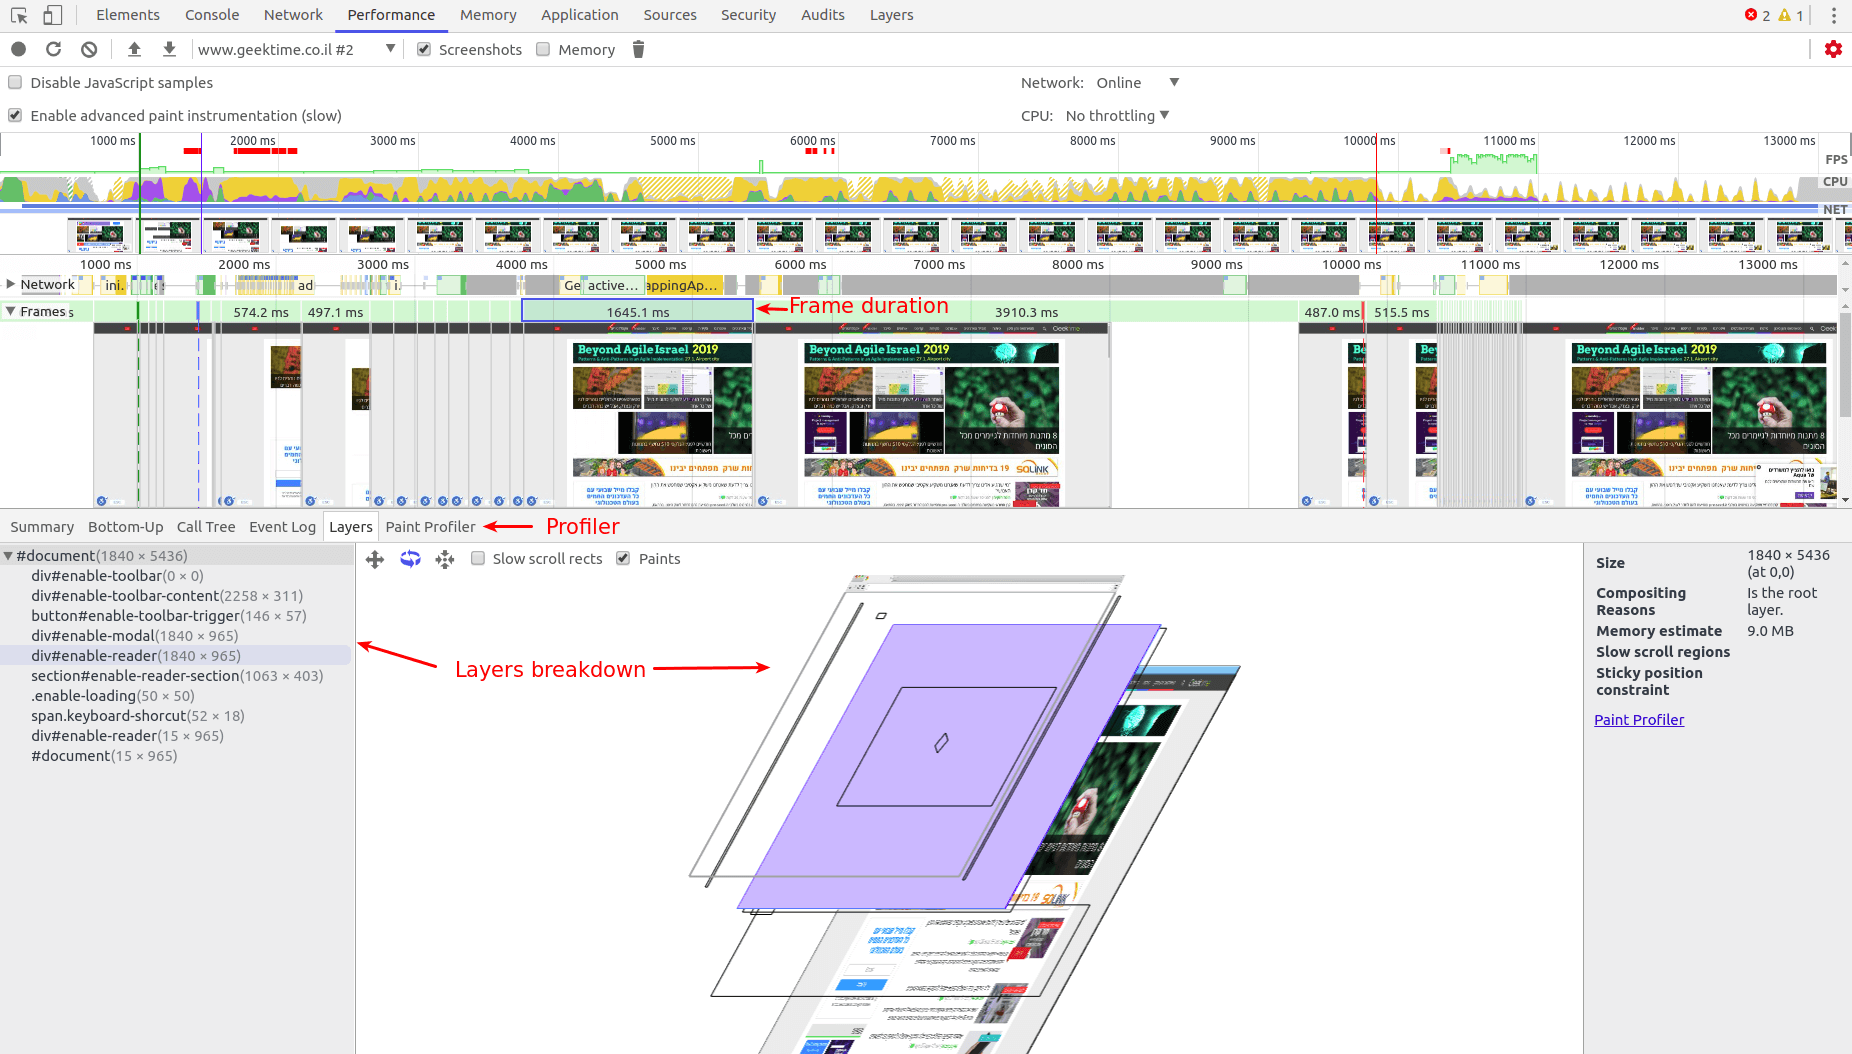
- Painted frames
- Interactions (user triggered events such as click/scroll…)
- Main thread call stack
We can dive deeper into a single frame paint process, view a layers breakdown and see the frame paint strokes via the paint profiler

Examples
There are many routines we can apply for a deep dev-tools performance inspection. The basic process is
- Record
- Make a change
- Record again
- Compare
- Repeat
Here are a few examples.
Blocking inefficient JS
At this routine
- Focus on performance warning indications.
- Zoom on the area, search for the JS call stack root, and it’s file.
- We find the file network request
- Block the request or all requests from the same domain
At the next screencast, we pin point pub_ads_impl.js script as a bottle neck, and block it’s domain.
Running a performance test again shows load time improve at about 67% (!!!) dropping from 13 seconds to 4, and the performance warning has disappeared.

Now that we contained the issue, we can decide how to handle it (remove, replace, delay, move to service worker…)
Improving UX with overrides
At this routine
- Slowly go over the recorded snapshots, looking for sharp changes.
- Find the faulty element on the DOM.
- Find the source file the applies the element CSS rules.
- Override the file.
- Make persistent changes to the local file.
At next screen cast, we see the page height changes due to a banner with an undefined height. Tightening the banner CSS class eliminates the issue.
Summary
Thats all we’ll cover at this post, however dev-tools has a lot more to offer.
Mastering it can make a very powerful developer, and make huge impact on the project bottom line.